Class insights
The grading you have already done, turned into a picture of the class.
Once you have graded a few submissions, InteGrade shows you what the class actually did: how scores are spread, and which questions did the damage. It builds as you grade, so it is worth glancing at halfway through rather than only at the end.
This is included on both plans, at the assignment level.
The distribution
On the assignment page you get a grade distribution for the class, and a breakdown per question.
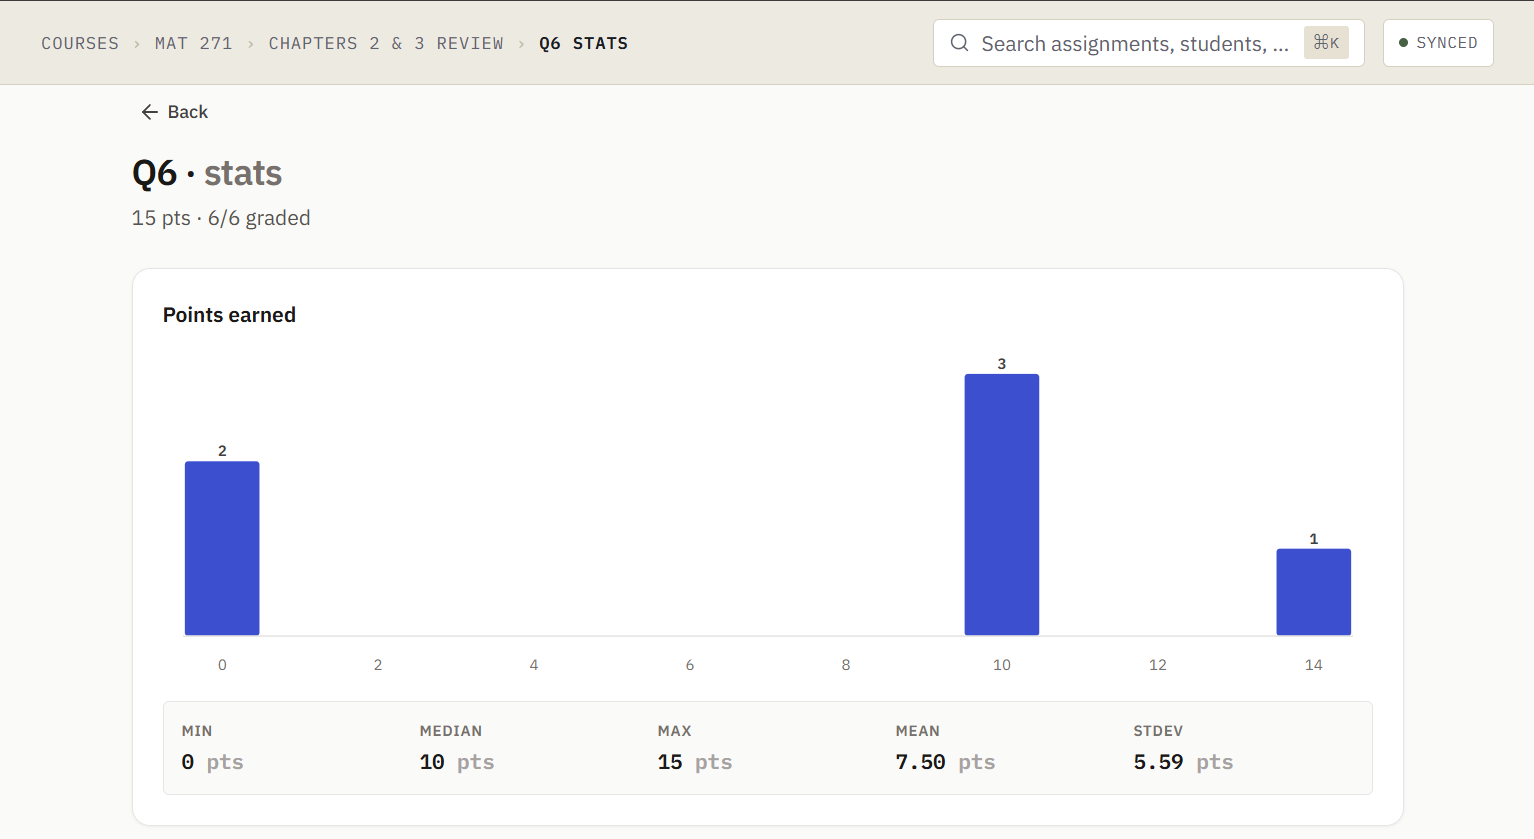
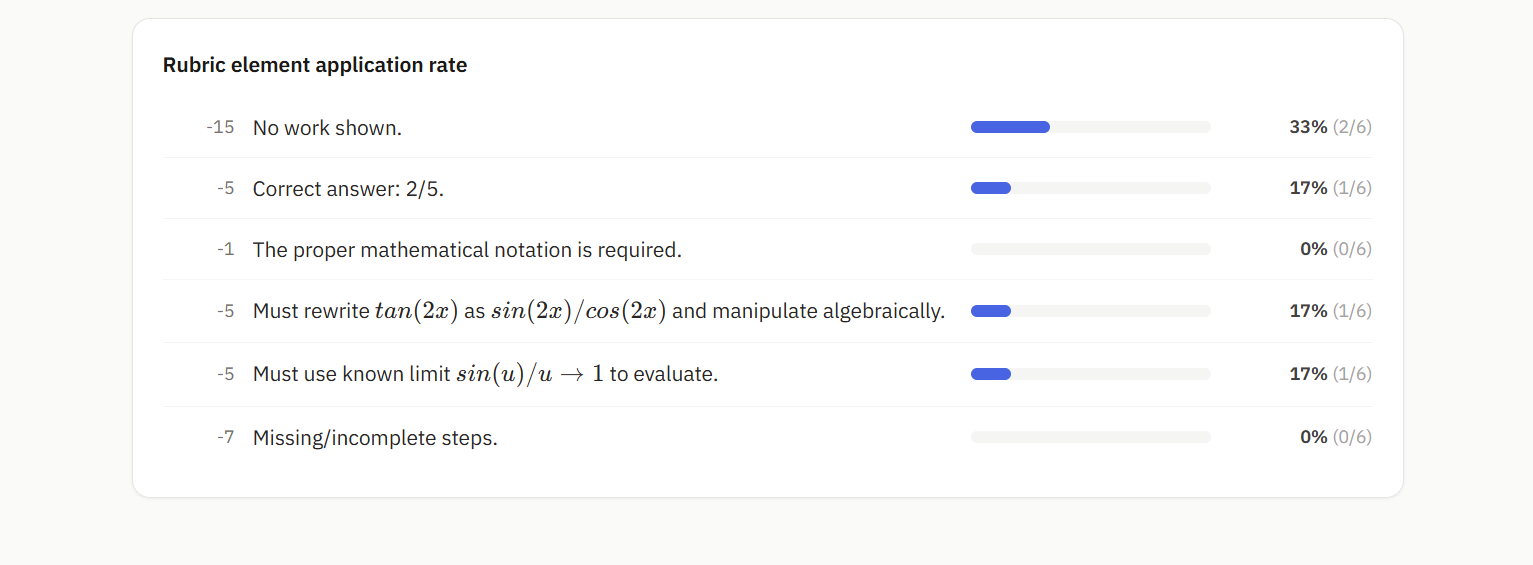
You can look at it in points or as percentages, and switch between a per-student view and a per-question view. It updates live as you grade; there is nothing to refresh.
Per-question detail
Open any question's stats to see just that question: how the class scored on it, and how it compares to the rest of the assignment. This is the fastest way to answer "was that question too hard, or did they genuinely not know it".
What to do with it
- A question everyone missed is usually a teaching signal, not a student signal. It is worth a slide next week.
- A question that splits the class, with a clump at full marks and a clump at zero, usually means one shared misconception, not a hard question.
- A rubric item you applied to most of the class is worth rewording next term.
Across courses
What the full version adds is scale: the same picture rolled up across every course in a department, so a head can compare sections and questions in one place. See Grade Explorer.